After helping release MapTable, I knew I wanted to make it more accessible for non-programmer types. While my post about using MapTable in WordPress was a start at this, you still had to have be fairly comfortable with code.
No longer! As of today, you can now use a stand alone web site to generate high resolution choropleth maps: enter MapTableMaker! This is an web application that let’s you enter CSV values for each country and quickly generate a choropleth map of the values. It allows you to specify both positive integers which will render in blue and negative ones that will show in red. It uses a percentile scale to distance the colors so they’ll be more easy to discern from each other. The resulting map is high resolution and print-ready. Here’s an example:
Of course, if you’d like run your own instance of this, MapTableMaker is fully open source (MIT). Check out the GitHub page for MapTableMaker for details on how to get your own server set up!
The other day I was working on redoing our old Internet governance meeting page. On it, there was a simple histogram of the meetings across a year. It looked like this:
Seeing this server side generated, non-responsive, raster based image, I thought, “We can make this waaaaay better”. So, I went about looking for a drop in replacement that would fix all that, much like MapTable fixed our server side, raster based non-responsive maps.
I tried a number of full blown graphing libraries (jqPlot, Flot and jQuery sparkline, all awesome in their own right) as well, I looked at the top available JS solutions. They all failed me in one way or another. Some of them didn’t like having hundreds of data points being rendered on them. Some of them added unwanted anti-aliasing on 1 pixel wide elements (I’m looking at you Canvas!). Many of them were going to take a lot of effort to look good on mobile devices at the horizontal scaled I was looking for.
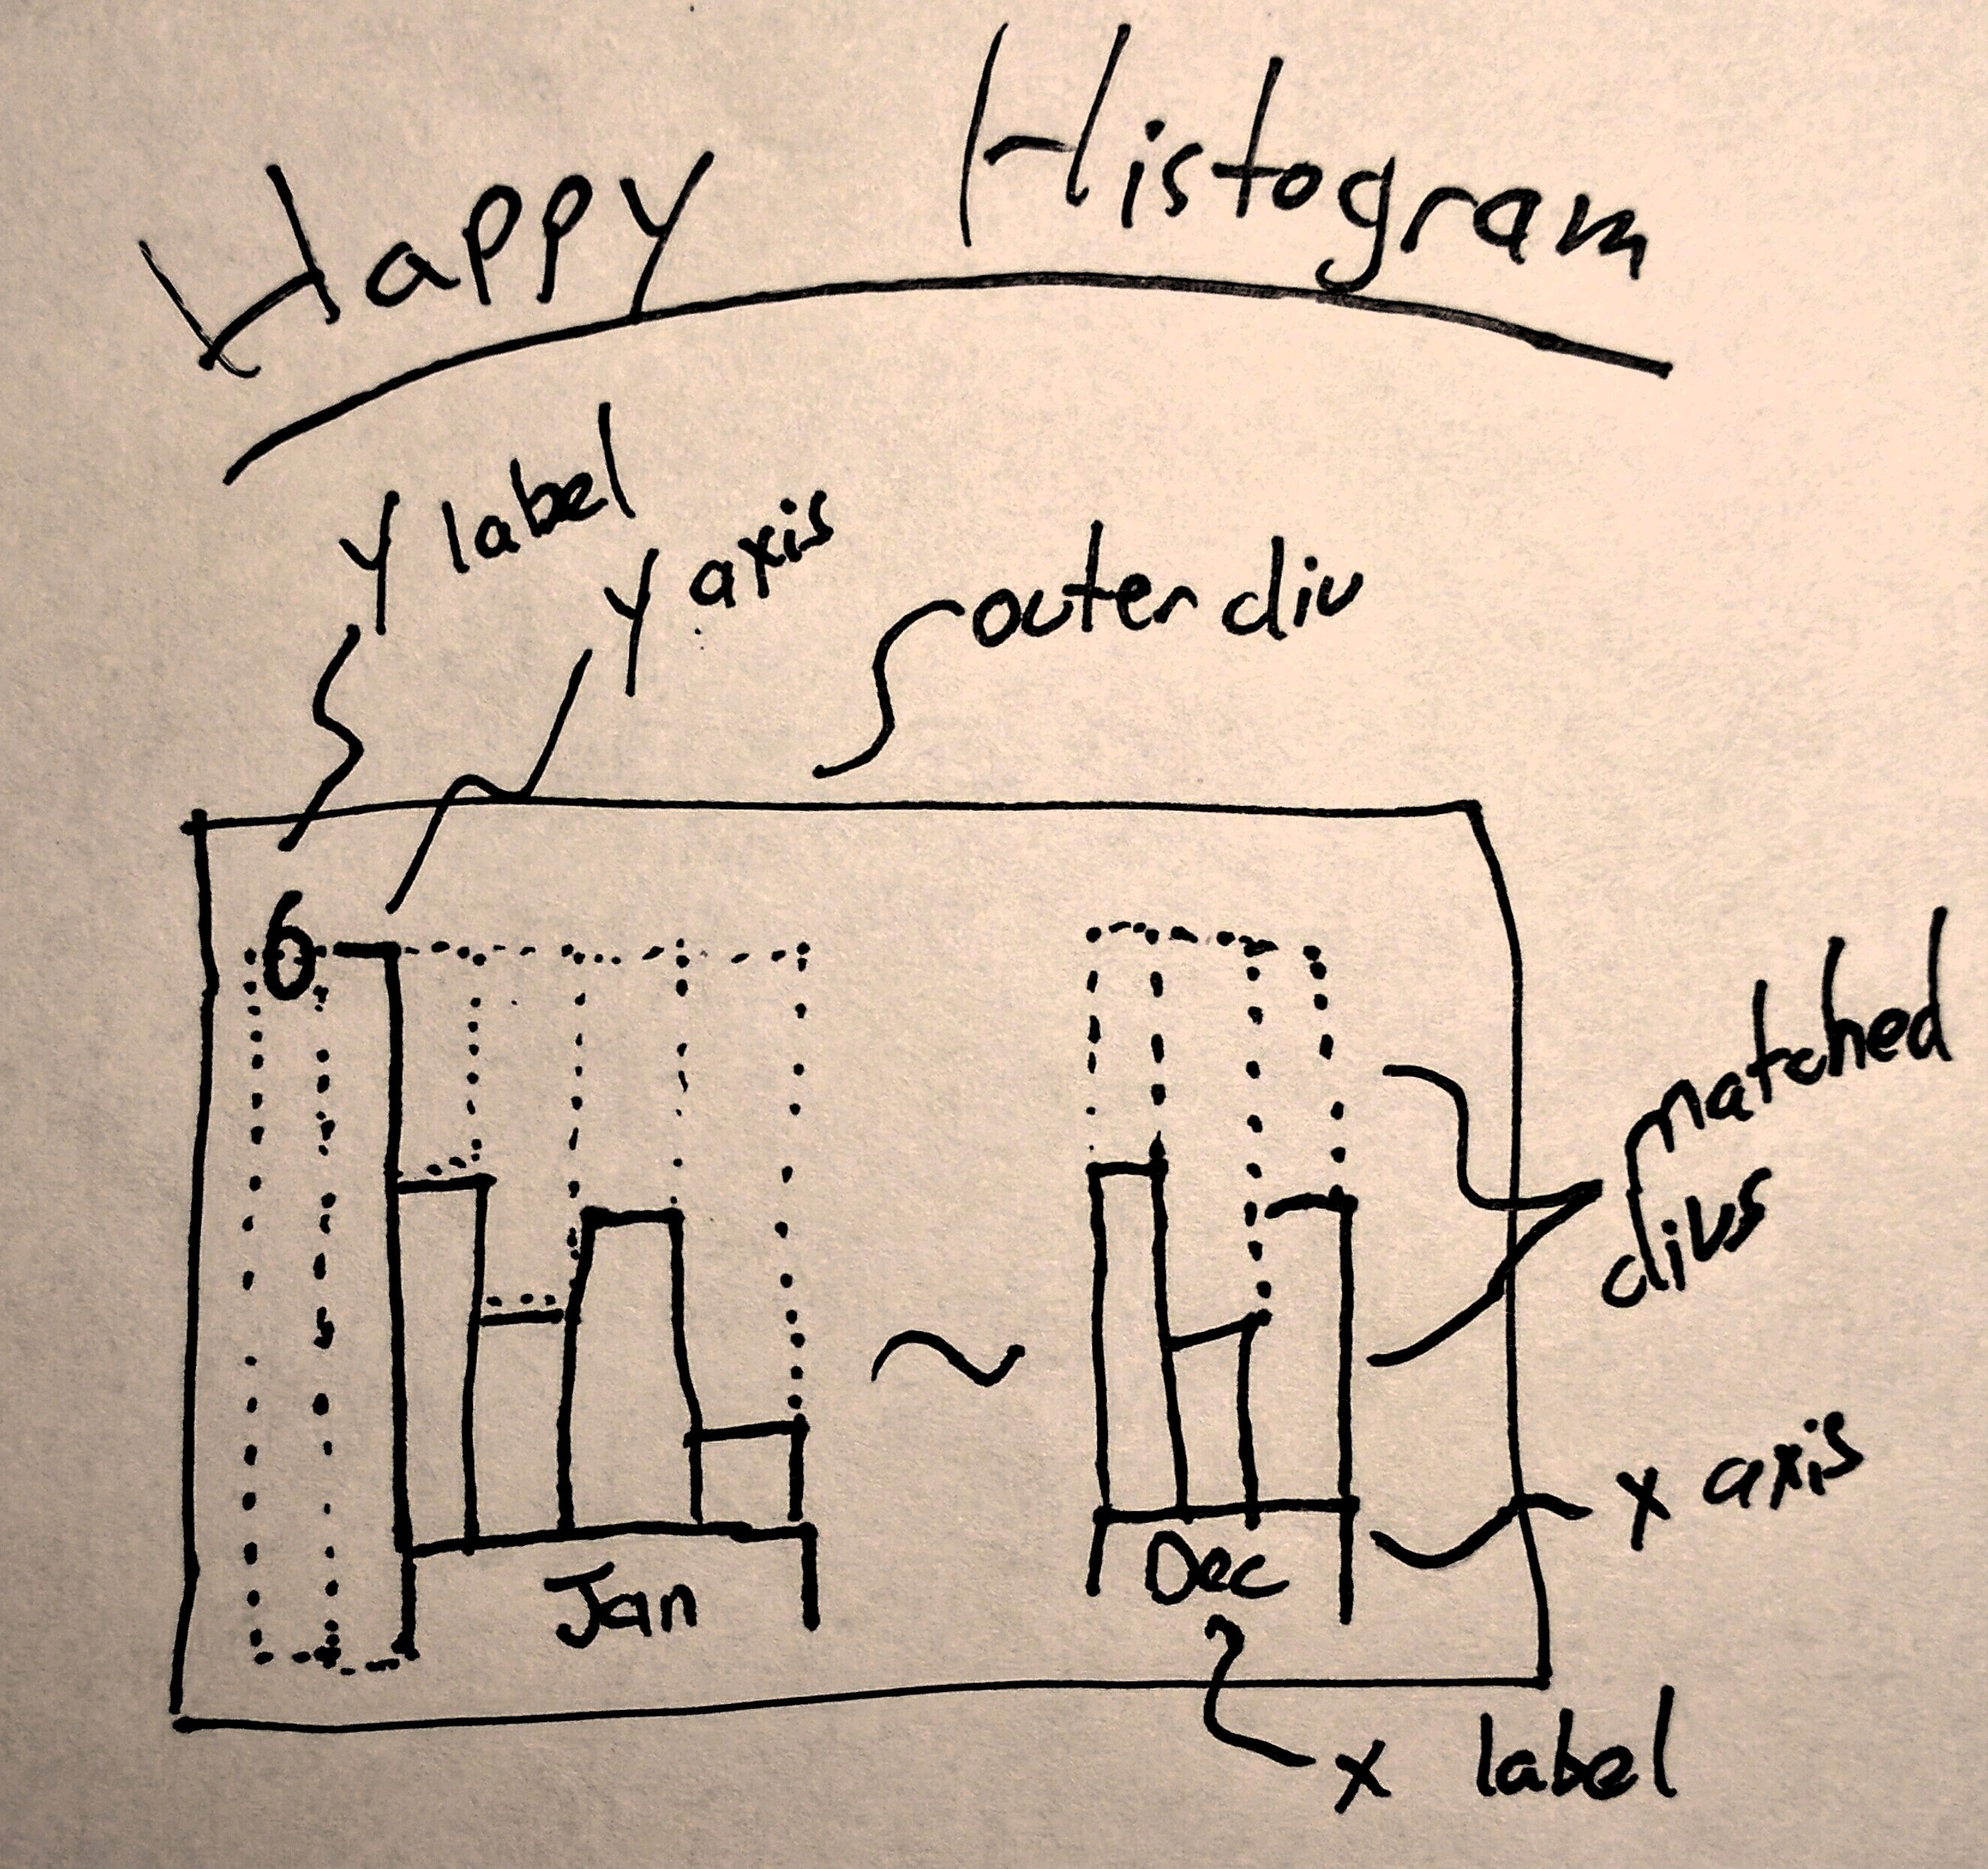
So, decided roll our own. And, of course, I decided to open source it ;) Had I drawn it before I made it, I would have drawn something like this:
The idea is that the whole thing would just be made of DIVs styled by CSS. Since CSS is insanely precise, even allowing for negative margins, you can skooch things like x and y axes labels just where you want them.
Thus, Happy Histogram was born:
What you see there is the exact same graph as above, rendered with a whopping 900 byte JavaScript Library. Check it out on Github!
If you want to customize it, just throw a little CSS at it and make it your own:
Or maybe you just want to show one value per month? Easy Peasy:
Likely I won’t do too much more development on this unless as it is fully formed and already deployed. However, part of my job satisfaction right now stems from the fact that all new features always get pushed upstream, so y’all might see more work on this soon!
I’ve been doing a lot of work in the day job working with Joseph McCullough’s wonderful Stupid-Table-Plugin for jQuery. This allows you to take a static table and with a little JS code, make it into a dynamic, client side sortable table. As well it’s HIGHLY configurable and totally awesome!
The Odd Behavior
However, I noticed when I had a table with data like this:
Fruit
Color
banana
yellow
peach
yellow
squash
yellow
apple
red
Sorting by “Fruit” worked exactly as expected. However, sorting by “Color” yielded odd results. While the 4 colors always were in the correct order (grouped together before or after “red”), the fruit column would change order if you clicked the “Color” header more than twice. Very confusing! Upon close inspection, on the 1st, 5th, 9th etc. clicks of “Color” the “Fruit” columns would be the same order and the same is true of 2nd, 4th, 6th etc. clicks. It then dawned on me that Stupid-Table-Plugin was reverse sorting rows with identical values each time I clicked the same “Color” column head.
The untangle
The fix, once knowing the problem, was easy. Just declare a data-sort-value for each color and append a random string to it (eg foo, bar, baz):
Fruit
Color
banana
yellow
peach
yellow
squash
yellow
apple
red
This way the colors will always be sorted in a consistent order. Point haired bosses rejoice – your underling coder made your table sort right!
Finally, if you are sorting a BIG table with a lot of data-sort="int" instead of data-sort="string", like above, you can simply make your values into data-sort="float" and concatenate a random, but unique to that row, decimal onto data-sort-value (eg, “300” => “300.0002” and “90” => “90.0301”). This way the sort will still work. If you tried to sort the float values as a strings, it would put “300” before “90” ;)
Let’s get this out of the way upfront: the most recent installation of the Star Trek reboot, “Beyond”, was exactly what I’d hoped it would be. It was an action packed, summer fun movie. It did not exceed, but definitely met my expectations.
The end however, was totally silly. It was the peak of the action and the sound effects and music (more on this in a second) were so loud I don’t think any one could hear my wife and I laughing. Like, laughing to the point of crying because what we were watching was so funny. But, for me at least, I kept on thinking, “wait – what?” There’s no way modern crypto would allow this scene! Let alone hyper futuristic crypto of 2263! Let me explain.
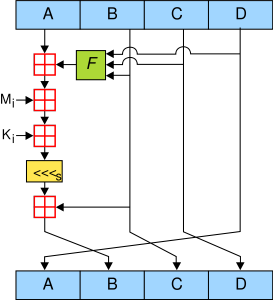
In the end of the move (yes, like I said, spoilers) the Enterprise crew is rocking the 99 year old USS Franklin. They are fighting the boss of the movie, Krall (not to be confused with Khan), who has control of a massive swarm of space ships based on alien technology. The swam is all perfectly in sync, just as you’d expect your alien swarm army to be. This, by definition, means that they are communicating with each other in real time to coordinate complex movements in 3d space. And how did they figure out how to beat the boss? Well, simply by “corrupting their communication with radio waves”. Radio waves like Sabotage, by the Beastie Boys. That’s right, the Beasties are literally weaponized to literally blow up the enemy hordes. Here’s the Franklin “surfing” the enemy swarm with them blowing up in their wake (click through to see the the preview where the gif came from):
So, aside from the fact that radio waves travel at the speed of of light and should be radiating out in all directions, not trailing behind them, how exactly was this supposed to be working? According to wikipedia, “they [Spock and Bones] learn that VHF transmissions can disrupt Krall’s communications and destroy his fleet.” But, like I said, this is the year 2263! Surely the alien technology powering this swarm has sufficient encryption to ensure that simple VHF radio waves won’t interfere with communication, right? Beyond things like TLS Handshakes, PKI (or even hash-chains if you wanna get tricky), basic header checksums, like in IPv4 would prevent this type of interference.
But, maybe not? Maybe the aliens implementing the swarm networking were just lazy? For example, the MD5 hashing algorithm was released in 1991. By the late 90’s and early 2000’s it was the de facto way to store passwords in databases. However, as early as 2005 collisions had been proven to be a reality. In 2008 at the 25th Chaos Communication Congress, researchers categorically proved that no one should trust MD5. Later that same year CERT issued a CVE agreeing. Fast forward 4 years to 2012, and what do we find? 43 million hacked passwords in unsalted MD5 is what we find. Well, we found out today (Sep 1, 2016), but the coders responsible for securing tens of millions of accounts back in ’12 should have known better. So yeah, maybe the aliens were more focused on meeting deadlines than they were in defending against VHF interference?
While I was on vacation, I forgot my laptop charger. I found on amazon that you can get an OEM charger for the XPS 13 (9350) for about $30. This is fine, it will work the prior gen XPS 13 with out USB-C/Thunderbolt too. I got it and used it for the remainder of my trip.
Totally awesome list! I got the charger today, so I don’t have any long term usage notes just yet. However, given it can both charge my phone over speedy USB-C, or dual charge my laptop AND my phone, as it has normal USB port to charge with, I’m fairly confident it’s my new fave travel charger. One caveat is that it does not come with a USB-C to USB-C cord. I got a nice looking 10′ one which I’ll put a velcro tie on when it arrives.
1/4/17 Update – I’ve been using this charger for 4 months now and it’s awesome! I got solid, braided 10′ USB-C <-> USB-C cable to use with which I recommend as well. It comes in 6′ flavors as well. Cable aside, the only caveat is that the charger does get quite hot – but so far not so much that it has me concerned; I don’t see any signs of the plastic discoloring.
I volunteered to show folks our Laser Cutter. This is by far one of, if not *the*, most popular tool at the SYN Shop. In preparation of showing folks how it worked, I made a bunch of cubes. Not just any cubes though! I started with a 1.6″ cube at Maker Case with finger joints. I then added our logo. I did a test run and quickly saw that the translucent side of the acrylic I was using looked much better when viewing it from through the oppisite clear side, instead of viewing it directly. I reversed our logo and as well added a very small mark in the upper left. This mark would allow me to run two discrete jobs: an engrave job and then a cut job. If you do them as one the laser cutter will engrave all your cuts and then cut them – a huge waste of time. The mark in the upper left allows me to keep the registration the same as long as I don’t move the bed or the piece on the bed.
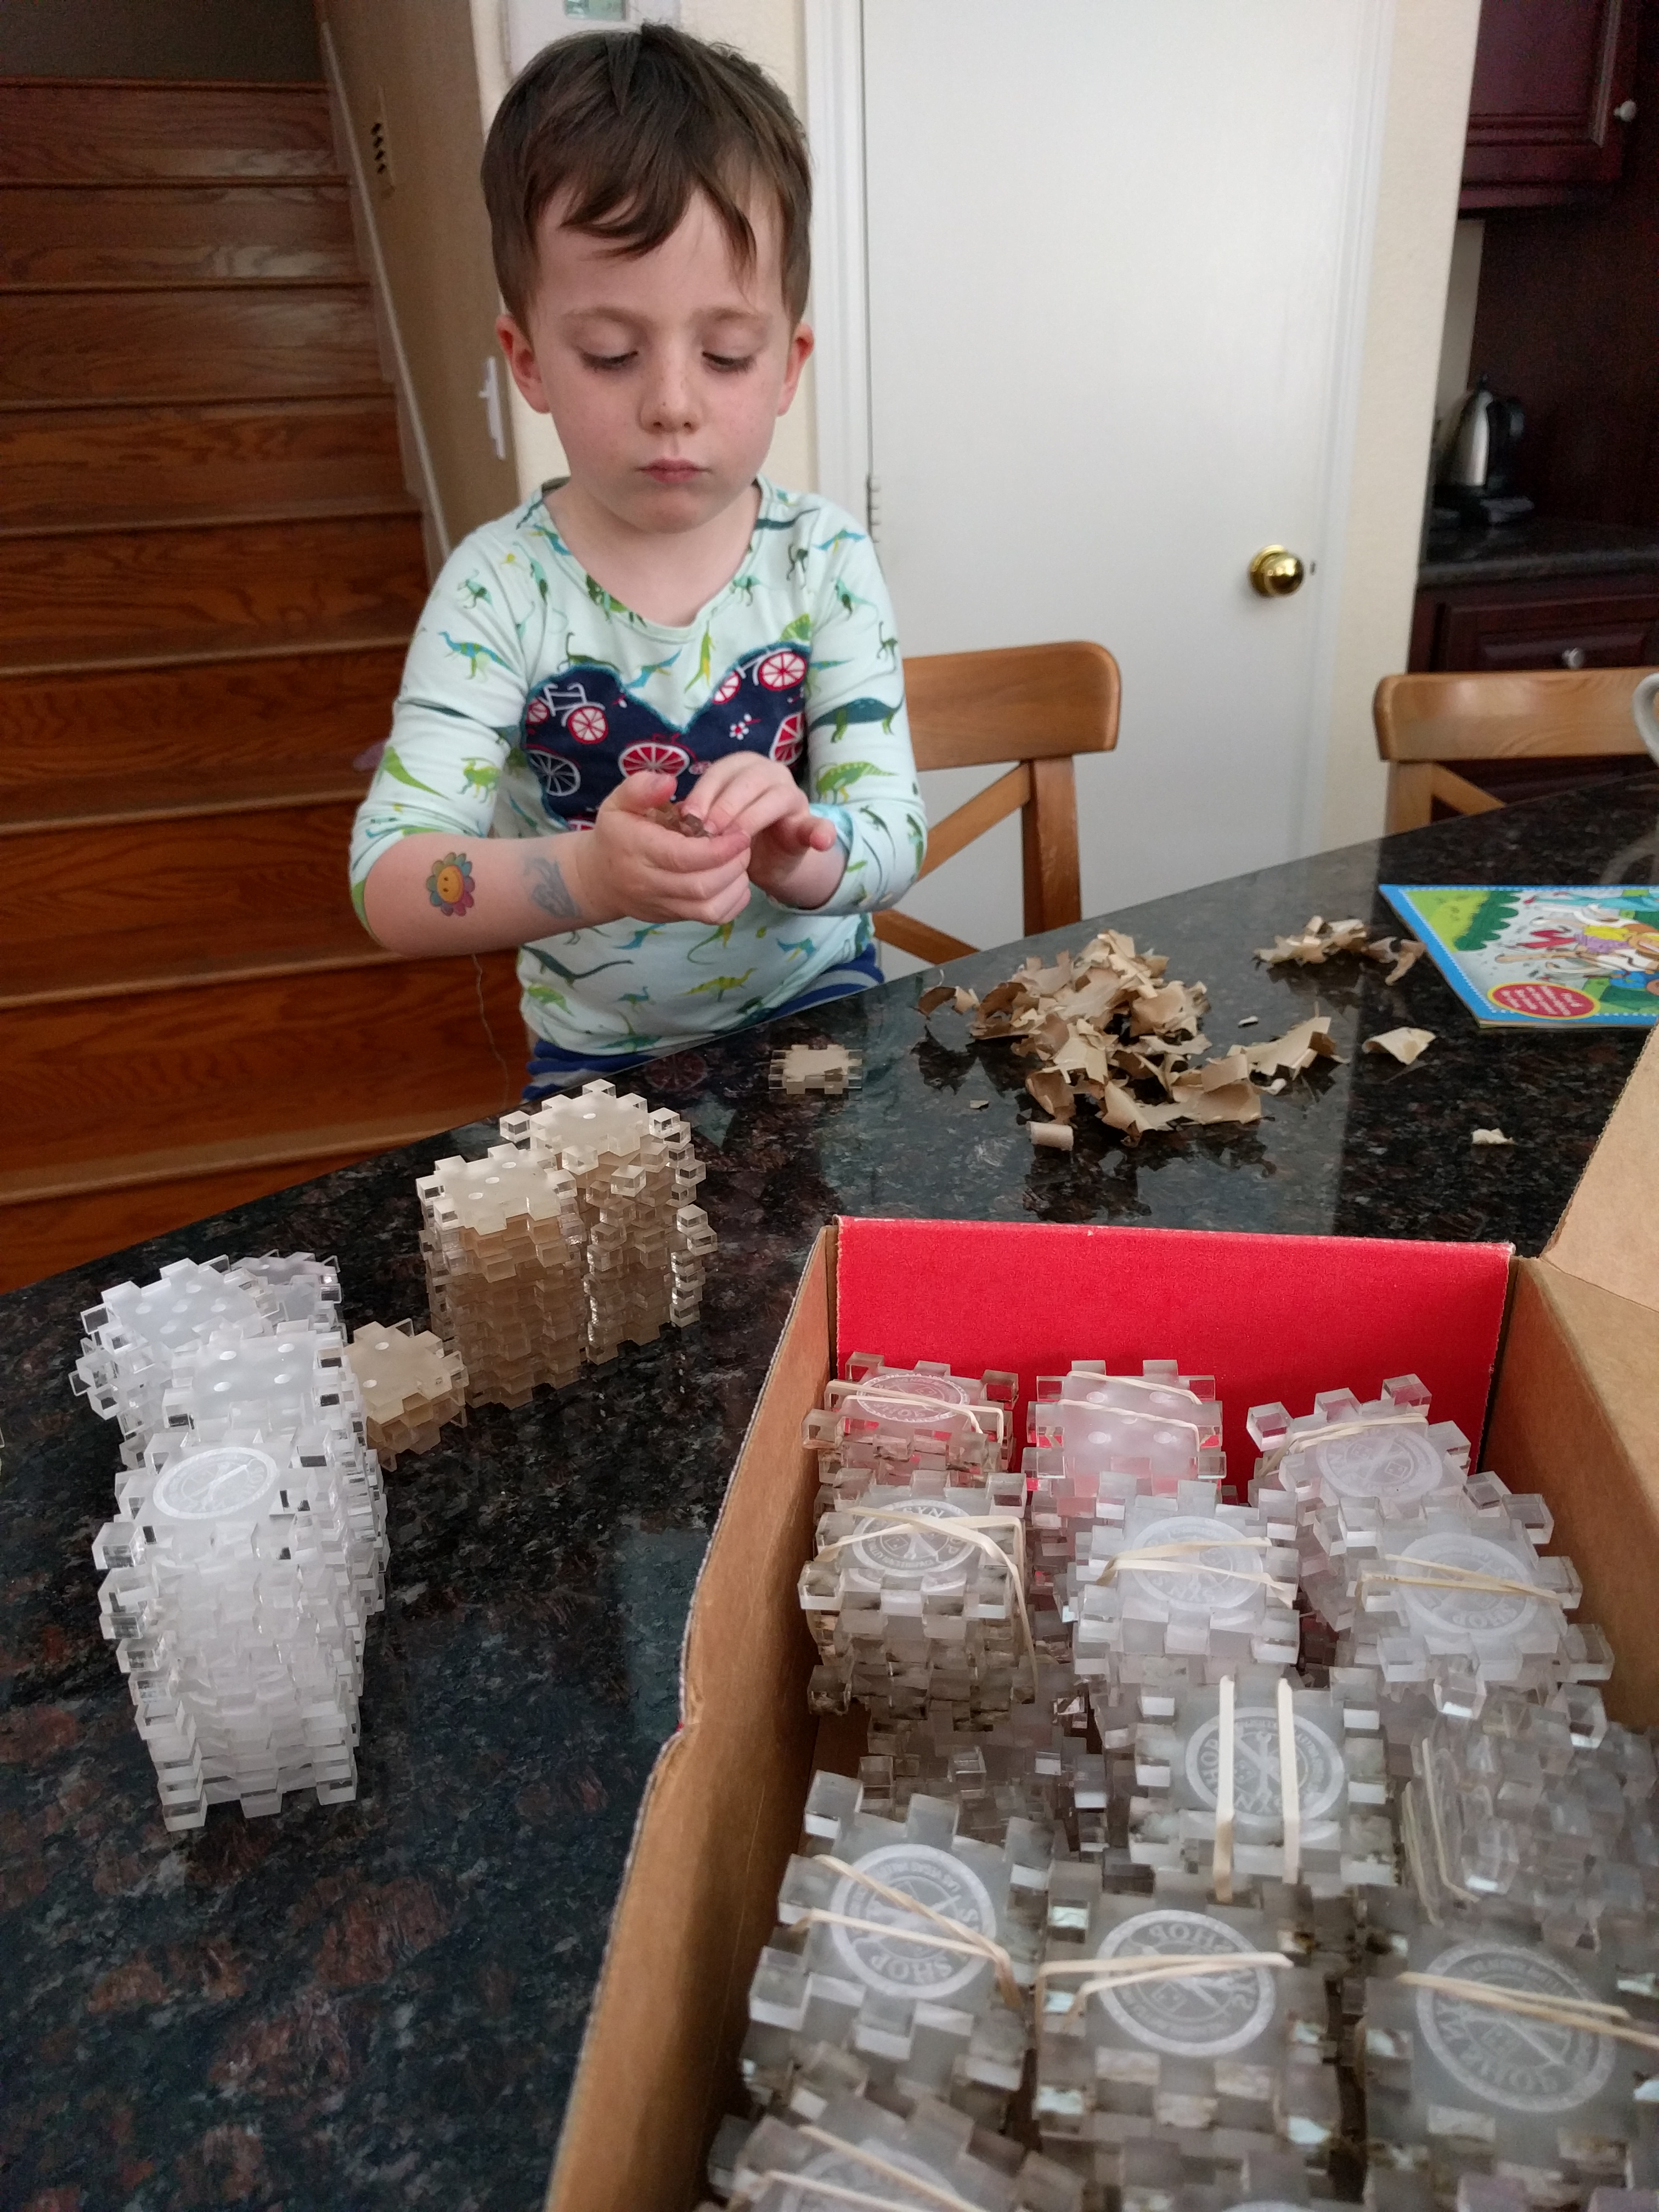
After feeling confident I had a good prototype design and size, I embellished it a bit by adding the 5 dice sides 1-5, the sixth would be our logo. I then laid it out as many up on the design as our laser cutter would handle, 4 x 3. Each sheet took over an hour to engrave the logos and dice faces and cut. I think I ended up making 48.
I learned after doing one sheet later on that though you get a bit less burn marks when you leave the protective sheets of paper on – it takes WAAAAAAY longer to peel when it has a logo engraving into it one side and then the cube face cutting it too. I pre-peeled both faces to save time. However, my son was totally into the production of peeling, stacking, and rubber banding the whole thing. I didn’t even need to tell him that he and his sister would get one to share after we ere done. We had fun!
During the event it self, I wanted to keep the laser cutter running to show how it works. As well, we quickly ran out of acrylic dice, so I needed another design to cut. I found a good, butterfly image that I traced in Ink Scape to create a nice looking SVG. From that, I made a bunch of test cuts and then just left it running during the day. As soon as the job was done I could pop open the lid and hand out hot, freshly cut butterflies.
All of the SVGs in this post are free to use for what ever purpose you want. It’d be great to hear of any uses though! I actually have a huge backlog of SVGs I’ve created over the past 1+ year that I should share…
Finally, here’s a video of my kids very much enjoying two octopi 3D printed with heat sensitive filament (also free handouts that day ;)
After my upgrade to my new phone, I accidentally deleted the list of all my RSS feeds I follow. It took some months to remember all the different ones, but I’ve finally recreated the entire list and re-subscribed to them all. I use RSS Reader on Android with pro version (no ads, no tracking!).
After completing the great resubscribe of ’16, I decided to make a post about my list mainly so I have a backup but also so my friends who sometimes ask where I get my news can follow along if they so desire.
A Few Thoughts on Cryptographic Engineering – Mathew Green is the only person who I think actually earns his keep as, “Foremost Authority on Crypto”. When there’s a vulnerability found and you want to know how bad it actually is, read this guy.
Hacker News Daily – I can’t stand reading Hacker News full bore, so the top 10 most commented daily is just right.
Background: I don’t know the background on this one! I had it written down in the queue of band names to publish but there were no notes with it. This one is crude and rude with no inside jokes or puns. Enjoy!
After my last post on MapTable, a friend of mine asked how he might include a map and table in a blog post on a WordPress Instance. In this post I’ll outline the steps to doing just that.
Overview
The steps to render a MapTable in WordPress post are:
Looking at the source of that page, we see this code:
In order to render these in your blog post you need to switch to “Text” mode when editing your post (as opposed to Visual). Please note WordPress’s word of caution:
Switching between Visual and Text view can cause some of your HTML entities to be lost. This is due, in part, to the manner in which TinyMCE handles your HTML. If formatting is very important, do not switch between views. If you’re writing a lot of code, we suggest you remain in the text editor.
Following their advice, I don’t ever edit in visual mode.
So, now that you’re in text mode, go ahead an paste in the those three script and two style blocks.
2: CSV (or JSON) FTW
MapTable is very lenient on the format of the data you give it. While you do need to have at least Latitude and Longitude fields to render a map, you don’t need them if you’re just rendering a table! For our 6k aiport example, here’s what the first bit of the CSV will look like:
airport_id,name,city,country,iata_faa,latitude,longitude
1,Goroka,Goroka,Papua New Guinea,GKA,-6.081689,145.391881
2,Madang,Madang,Papua New Guinea,MAG,-5.207083,145.7887
3,Mount Hagen,Mount Hagen,Papua New Guinea,HGU,-5.826789,144.295861
4,Nadzab,Nadzab,Papua New Guinea,LAE,-6.569828,146.726242
5,Port Moresby Jacksons Intl,Port Moresby,Papua New Guinea,POM,-9.443383,147.22005
6,Wewak Intl,Wewak,Papua New Guinea,WWK,-3.583828,143.669186
7,Narsarsuaq,Narssarssuaq,Greenland,UAK,61.160517,-45.425978
Unlike the script and CSS files, this needs to originate from the same domain as your blog is hosted on. To facilitate this, you’ll need to upload the .csv file to your blog via the “Add Media” feature. If you get an error like “Sorry, this file type is not permitted for security reasons.” then you’ll need to try and allow this file to be upload. This forum post does a good job of describing how to do it – however please note: this may introduce some security risks to your site. Please make this change with caution!
In the end, despite explicitly adding “json” as a file type, I could not upload a file ending in “.json”. I had to change the name of “ne_110m_admin_0_countries.json” to “ne_110m_admin_0_countries.js”.
JavaScript
We’ll cull a bit of the javascript, but it otherwise is just about identical to the one on the MapTable demo page. As well, we prepend the JS with a bit of HTML and styles. Here is the complete code I’ll use to render my map:
MapTable now!
This is a MapTable of “Global Airport by Countries – +6000 rows, Log scale for country colors, tooltip” embedded in WordPress:
Caveats
If you use more than one MapTable on your blog, you’ll really want to move the .css and .js files to be in your template, as you’ll be including them many times, possible more than once on places like your home page. As well, if you do use more than one MapTable – you’ll only need to upload the ne_110m_admin_0_countries.json (or .js in our case ;) once and re-use the URL.
As well, I had some trouble getting the tooltip to work just as it is in the example. If I used HTML in it, the JS would break :( I suspect this has to do with the way WordPress aggressively adds line returns to HTML. This included taking a lot of line returns out above the MapTable JS and between my <script>, <link> and <style> tags.
Finally, if there is sufficient interest, I can see that a MapTable WordPress plugin would be really handy! Let me know if you’re interested and I’ll see what I can do!
For some time now, I’ve been thinking that I need to add a category to this blog that is for cataloging and giving away for use punk rock band names. I guess I should really call them just “band names”, as they’re not all categorically for punk or punk rock bands. However, for even longer, I’d say back in school when I was hanging out with Scott at the old location of the Bike Doctor, we’d say something funny and say, “man, that’d be a great punk rock band name!” So, this is the first in a series of names that I think some one should use as their, possibly punk rock, band name. Any names in this category are free to use with no reservations and what not. But maybe you’d like to give me a t-shirt of your band? A couple of tickets when you come to town?
For each post in this category I’ll give the name and any background on how I came up with it. Enjoy!
Punk Rock Band Name:Promiscuous Profusion of State
Background: I was reading up on Fathom and came across this passage (emphasis mine):
A study of existing projects like Readability and Distiller suggests that purely imperative approaches to semantic extraction get bogged down in the mechanics of DOM traversal and state accumulation, obscuring the operative parts of the extractors and making new ones long and tedious to write. They are also brittle due to the promiscuous profusion of state. Fathom is an exploration of whether we can make extractors simpler and more extensible by providing a declarative framework around these weak points. In short, Fathom handles tree-walking, execution order, and annotation bookkeeping so you don’t have to.


 Let’s get this out of the way upfront: the most recent installation of the Star Trek reboot, “Beyond”, was exactly what I’d hoped it would be. It was an action packed, summer fun movie. It did not exceed, but definitely met my expectations.
 In the end of the move (yes, like I said, spoilers) the Enterprise crew is rocking the