Category Archives: JavaScript

Keys-To-The-Tunnel 1.1.0 released

3 minutes, 14 seconds

Hey hey! I’d been meaning to consolidate some of my VMs I’m paying for and semi-accidentally deleted the place where I was hosting my work’s instance of Keys-To-The-Tunnel (KTTT). With this VM deletion, I decided to leverage my recent dabblings with Caddy and do a big refactor of KTTT by replacing Apache with Caddy.

As a reminder, KTTT is an easy way for an organization which both develops web apps and uses GitHub to share their local dev app on the internet via a publicly accessible URL all protected with solid TLS and SSH encryption.

Let’s dive into what the update means and why I did it!

Parenthetical aside about TLS for local Android development

Originally I asked if potential KTTT users :

ever need to test an Android application against a web server such that you need a valid TLS certificate?

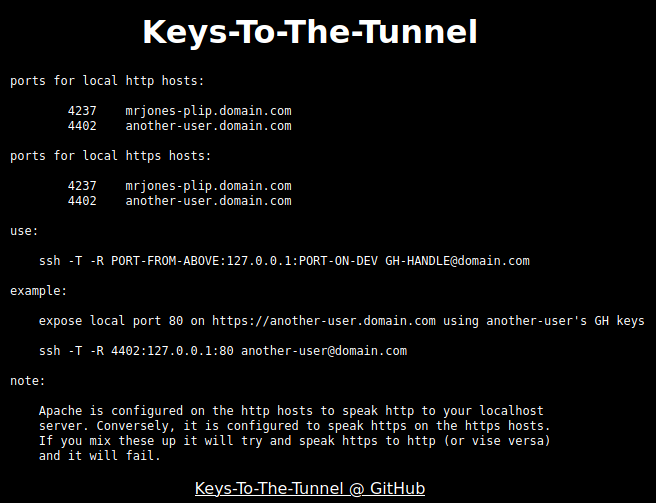
Not so good idea on my original KTTT post

This is actually a bad idea if all you need is a valid TLS cert for Android testing. The reason is that you’ll literally be holding your phone in your hand which is less than a foot from the computer hosting your app you want to test against. By introducing KTTT into the mix, you send your traffic thousands of miles/kilometers (you pick which) and back just to get a TLS cert. Crazy times!

A much better approach is to use something like local-ip.co . If you want an easy way to keep your traffic entirely local, you can use nginx-local-ip with a one line docker compose call to set up everything you need to locally run a local-ip.co TLS. It’s a really sweet set up! (I’m biased because I help author some of it ;)

KTTT is still a great idea if you need to share your local dev environment though!

With that out of the way, back to KTTT updates…

What’s new with KTTT

For an end user of KTTT who just wants to share their app, it’s now WAY easier to figure out which SSH command to run and which URL to share. This is thanks to the handy web app which walks you through three easy questions:

  1. What is your GitHub Username?
  2. What port is your app running on locally?
  3. Is your local app using http or https?

This is MUCH better than wading through a list of random ports and other GitHub usernames which you only cared about your username and port. Here’s what the updated web app looks like in action (15 second video):

For the administrators of KTTT, you’ll note that KTTT now uses Caddy instead of Apache. While there’s nothing wrong with Apache, Caddy is a simpler take on the needs of an app like KTTT that requires a bunch of small reverse proxies. Caddy is 7 years old and came to being in the world of Docker, containers and micro-services. Where as Apache is 27 years old and came being near the birth of world wide web.

Ironically, a key feature of Caddy, the ability to automatically provision and renew TLS certs, is NOT being used. Instead, the opportunity to use a wildcard TLS cert came up via acme-dns.io and I took it.

That all said, it’s a joy to use Caddy because I can create a simple JSON file with four lines to define a reverse proxy:

mrjones-plip.awesome-tunnel.plip.com {
   tls /etc/certs/fullchain.pem /etc/certs/privkey.pem
   reverse_proxy 127.0.0.1:3089
}

Love it!

Putting it all together

The web app above gives a pretty good idea of the improvements, but since I added a demo video of the whole KTTT experience on GitHub, may as well post it here in case you’re curious (44 second video):

Other odds and ends in 1.1.0

There’s also a bunch of other fixes and improvments I made while in there. Here’s the notes from the 1.1.0 release:

  • Replace Apache with Caddy
  • Add mini web app to help devs figure which URL and SSH command to use
  • Unify mutli SNI certs to one wildcard with acme-dns.io (still using Let’s Encrypt though) per #1
  • Don’t overwrite existing user’s ports every time you run setup per #3
  • Don’t regenerate TLS certs every time you run setup per #3
  • Don’t rewrite vhosts in web server every time you run setup per #3
  • Update MOTD on login per #4
  • Try my hand at being an artist and create a KTTT logo

The one page invoicing web app I didn’t write

1 minute, 44 seconds

This past week I had to invoice a customer for some consulting I did for them. Late last year I used some rando site I couldn’t find again to generate an earlier invoice. This time, however, I thought that maybe I might be doing more consulting, so I wanted to be sure to use the same app going forward. Even better, it would be great if there was something that I could host myself to ensure any sensitive information in the invoice didn’t leak by accident.

After spending some time looking, I found a more than capable web app called “InvoiceOnline” written by Alex P. out Ukraine. It was near perfect!

I downloaded the repo and opened the index.html file in my fave browser. It just worked as expected, no web server, python or PHP needed. Sweet!

However, I went to add a long line item and the text just got cut off. What I needed was to have the input fields be changed to textarea fields. Since this was an open source project, easy peasy, lemon squeezy!

Oh, and I need to make sure when you print you don’t see any of the textarea artifacts (resize handle, scrollbars etc). Oh yeah, I also wanted to be able to set the currency explicitly. Also the “Save” and “Print” buttons didn’t seem to do anything. I also wanted to be able to add a note to say a nice “hey!!” to my customers when they see the bill. Penultimate, it’d be nice to host a version of it on my site and add the quintessential “Fork me on Gitub!” overlay banner. Finally, I reached out to Alex to see if he’d like to merge my changes back up to his master.

So, yeah, my “quick” generation of a “simple” invoice, ended being a morning gleefully spent incrementally improving an invoice app I didn’t write. I loved it!

See the live version on my site and check out the Github repo. Free invoice generation and free software for the win! Pull requests welcome ;)

Feb 8, 2010 Update – I had a feature request to support a logo being displayed. This feature has been added!

The way it works is that you provide a URL of your logo and then click “show” and size the logo to your liking. Default is to not use or show a logo. Enjoy!

Happy Histogram

2 minutes, 3 seconds

The other day I was working on redoing our old Internet governance meeting page. On it, there was a simple histogram of the meetings across a year. It looked like this:

Seeing this server side generated, non-responsive, raster based image, I thought, “We can make this waaaaay better”. So, I went about looking for a drop in replacement that would fix all that, much like MapTable fixed our server side, raster based non-responsive maps.

I tried a number of full blown graphing libraries (jqPlot, Flot and jQuery sparkline, all awesome in their own right) as well, I looked at the top available JS solutions. They all failed me in one way or another. Some of them didn’t like having hundreds of data points being rendered on them. Some of them added unwanted anti-aliasing on 1 pixel wide elements (I’m looking at you Canvas!). Many of them were going to take a lot of effort to look good on mobile devices at the horizontal scaled I was looking for.

So, decided roll our own. And, of course, I decided to open source it ;) Had I drawn it before I made it, I would have drawn something like this:

img_20161025_205850

The idea is that the whole thing would just be made of DIVs styled by CSS. Since CSS is insanely precise, even allowing for negative margins, you can skooch things like x and y axes labels just where you want them.

Thus, Happy Histogram was born:


What you see there is the exact same graph as above, rendered with a whopping 900 byte JavaScript Library. Check it out on Github!

If you want to customize it, just throw a little CSS at it and make it your own:

#year2 .yearHistogram .emptyTop { background-color: yellow; }
#year2  .yearHistogram .filledBottom:hover {background-color: #ddd;}
HappyHistogram('year2', Months, 'orange');


Or maybe you just want to show one value per month? Easy Peasy:


Likely I won’t do too much more development on this unless as it is fully formed and already deployed. However, part of my job satisfaction right now stems from the fact that all new features always get pushed upstream, so y’all might see more work on this soon!


Untangling odd behavior of stupidtable.js

0 minutes, 54 seconds

I’ve been doing a lot of work in the day job working with Joseph McCullough’s wonderful Stupid-Table-Plugin for jQuery. This allows you to take a static table and with a little JS code, make it into a dynamic, client side sortable table. As well it’s HIGHLY configurable and totally awesome!

The Odd Behavior

However, I noticed when I had a table with data like this:

Fruit Color
banana yellow
peach yellow
squash yellow
apple red

Sorting by “Fruit” worked exactly as expected. However, sorting by “Color” yielded odd results. While the 4 colors always were in the correct order (grouped together before or after “red”), the fruit column would change order if you clicked the “Color” header more than twice. Very confusing! Upon close inspection, on the 1st, 5th, 9th etc. clicks of “Color” the “Fruit” columns would be the same order and the same is true of 2nd, 4th, 6th etc. clicks. It then dawned on me that Stupid-Table-Plugin was reverse sorting rows with identical values each time I clicked the same “Color” column head.

The untangle

The fix, once knowing the problem, was easy. Just declare a data-sort-value for each color and append a random string to it (eg foo, bar, baz):

banana
    
Fruit Color
yellow
peach yellow
squash yellow
apple red

This way the colors will always be sorted in a consistent order. Point haired bosses rejoice – your underling coder made your table sort right!

Addendum

I want to again thank Stupid-Table-Plugin for being awesome. Great discussions like Issue #106, “weird behavior when td have empty values” both gave me faith in the author as being open to feedback, and made me trust the plugin to be well thought out. Long term, this of course should be fixed, and hopefully will be with Issue #112 – “Sort on Multiple Columns”.

Finally, if you are sorting a BIG table with a lot of data-sort="int" instead of data-sort="string", like above, you can simply make your values into data-sort="float" and concatenate a random, but unique to that row, decimal onto data-sort-value (eg, “300” => “300.0002” and “90” => “90.0301”). This way the sort will still work. If you tried to sort the float values as a strings, it would put “300” before “90” ;)

MapTable in WordPress

3 minutes, 31 seconds

After my last post on MapTable, a friend of mine asked how he might include a map and table in a blog post on a WordPress Instance. In this post I’ll outline the steps to doing just that.

Overview

The steps to render a MapTable in WordPress post are:

  1. Include MapTable and related JS and CSS files
  2. Generating and posting your .csv file
  3. Author and post the actual JS for rendering the MapTable

Though this is specific to WordPress, the same logic applies to generically creating an HTML page in which you want to include a MapTable.

1: Ye Old <script> and <link> tags: MapTable, D3 and TopoJSON

Thanks to all the working examples hosted on the MapTable GitHub page, there’s no shortage of code snippets to look at on how to assemble the JavaScript and CSS to render a MapTable. I’ll be using the Example titled “Global Airport by Countries – +6000 rows, Log scale for country colors, tooltip“.

Looking at the source of that page, we see this code:


In order to render these in your blog post you need to switch to “Text” mode when editing your post (as opposed to Visual). Please note WordPress’s word of caution:

Switching between Visual and Text view can cause some of your HTML entities to be lost. This is due, in part, to the manner in which TinyMCE handles your HTML. If formatting is very important, do not switch between views. If you’re writing a lot of code, we suggest you remain in the text editor.

Following their advice, I don’t ever edit in visual mode.

So, now that you’re in text mode, go ahead an paste in the those three script and two style blocks.

2: CSV (or JSON) FTW

MapTable is very lenient on the format of the data you give it. While you do need to have at least Latitude and Longitude fields to render a map, you don’t need them if you’re just rendering a table! For our 6k aiport example, here’s what the first bit of the CSV will look like:

airport_id,name,city,country,iata_faa,latitude,longitude
1,Goroka,Goroka,Papua New Guinea,GKA,-6.081689,145.391881
2,Madang,Madang,Papua New Guinea,MAG,-5.207083,145.7887
3,Mount Hagen,Mount Hagen,Papua New Guinea,HGU,-5.826789,144.295861
4,Nadzab,Nadzab,Papua New Guinea,LAE,-6.569828,146.726242
5,Port Moresby Jacksons Intl,Port Moresby,Papua New Guinea,POM,-9.443383,147.22005
6,Wewak Intl,Wewak,Papua New Guinea,WWK,-3.583828,143.669186
7,Narsarsuaq,Narssarssuaq,Greenland,UAK,61.160517,-45.425978

Unlike the script and CSS files, this needs to originate from the same domain as your blog is hosted on. To facilitate this, you’ll need to upload the .csv file to your blog via the “Add Media” feature. If you get an error like “Sorry, this file type is not permitted for security reasons.” then you’ll need to try and allow this file to be upload. This forum post does a good job of describing how to do it – however please note: this may introduce some security risks to your site. Please make this change with caution!

In the end, despite explicitly adding “json” as a file type, I could not upload a file ending in “.json”. I had to change the name of “ne_110m_admin_0_countries.json” to “ne_110m_admin_0_countries.js”.

JavaScript

We’ll cull a bit of the javascript, but it otherwise is just about identical to the one on the MapTable demo page. As well, we prepend the JS with a bit of HTML and styles. Here is the complete code I’ll use to render my map:


MapTable now!

This is a MapTable of “Global Airport by Countries – +6000 rows, Log scale for country colors, tooltip” embedded in WordPress:

Caveats

If you use more than one MapTable on your blog, you’ll really want to move the .css and .js files to be in your template, as you’ll be including them many times, possible more than once on places like your home page. As well, if you do use more than one MapTable – you’ll only need to upload the ne_110m_admin_0_countries.json (or .js in our case ;) once and re-use the URL.

As well, I had some trouble getting the tooltip to work just as it is in the example. If I used HTML in it, the JS would break :( I suspect this has to do with the way WordPress aggressively adds line returns to HTML. This included taking a lot of line returns out above the MapTable JS and between my <script>, <link> and <style> tags.

Finally, if there is sufficient interest, I can see that a MapTable WordPress plugin would be really handy! Let me know if you’re interested and I’ll see what I can do!

MapTable.js for all your table and map needs!

2 minutes, 13 seconds

I’m proud to announce that I played a small role in releasing a great new JavaScript library called MapTable. This is an open source JavaScript library that accepts longitude and latitude data (CSV or JSON) as input, and outputs beautiful maps in native SVG with table of the data used to generate the map.  I said I played a small role in this release because Mohammed “Simo” Elalj did 99% of the coding of the library and I just swooped in for testing, PCH specific feature requests and pushing out new builds to GitHub. Version 1.0 of MapTable was technically released way back in December of 2014, but it has been greatly improved since then (again, almost entirely by Simo :).

pch.ixpdir.maptableVersion 1.1.1, the current version, was developed specifically so it could be used on PCH’s next generation Internet Exchange Point directory (IXP Dir). PCH’s IXP Dir was also the original use that MapTable was conceived for, so it has been a long journey until just now (as of Monday, July 25, 2016) that it has been pushed live!  My main role as an employee of PCH was to complete the nascent integration done a while ago and ensure that all feature requests were made on GitHub so that the improvements would be made upstream of us for all to benefit from. It was great fun to do a deep dive into a well though out and highly function JS library.

pch.homepageWhile I was in the IXP Dir, I also replaced the code on our home page which used an outdated version of MapTable. Fortunately, Simo had done PCH the huge favor of making one of the MapTable demo pages be based almost entirely on our home page. The ability to set an entirely custom color palette topped with icing on the cake of being able to specify an arbitrary SVG shape to use as markers on the map was just delightful!

While I’m wildly biased, MapTable is quite easy to use. Here’s the simplest incantation, taken directly from our docs:

Looking at the two examples I cited above, our home page and our IXP Dir, you can see that this simple snippet can be greatly extended to show either a stand alone map or an interactive, zoomable, filterable, printable, map downloadable, tooltipable and sortable map and table. The library is super awesome, and I recommend you start using it today! And yes, I just add “able” to tooltip. Try that in some other JS lib. I think not!

And, before I end this post, if you’re a JS developer and have some spare time, we’d love some help! I’m looking at you Issue #25!