2 minutes, 3 seconds
The other day I was working on redoing our old Internet governance meeting page. On it, there was a simple histogram of the meetings across a year. It looked like this:
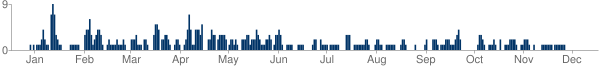
Seeing this server side generated, non-responsive, raster based image, I thought, “We can make this waaaaay better”. So, I went about looking for a drop in replacement that would fix all that, much like MapTable fixed our server side, raster based non-responsive maps.
I tried a number of full blown graphing libraries (jqPlot, Flot and jQuery sparkline, all awesome in their own right) as well, I looked at the top available JS solutions. They all failed me in one way or another. Some of them didn’t like having hundreds of data points being rendered on them. Some of them added unwanted anti-aliasing on 1 pixel wide elements (I’m looking at you Canvas!). Many of them were going to take a lot of effort to look good on mobile devices at the horizontal scaled I was looking for.
So, decided roll our own. And, of course, I decided to open source it ;) Had I drawn it before I made it, I would have drawn something like this:
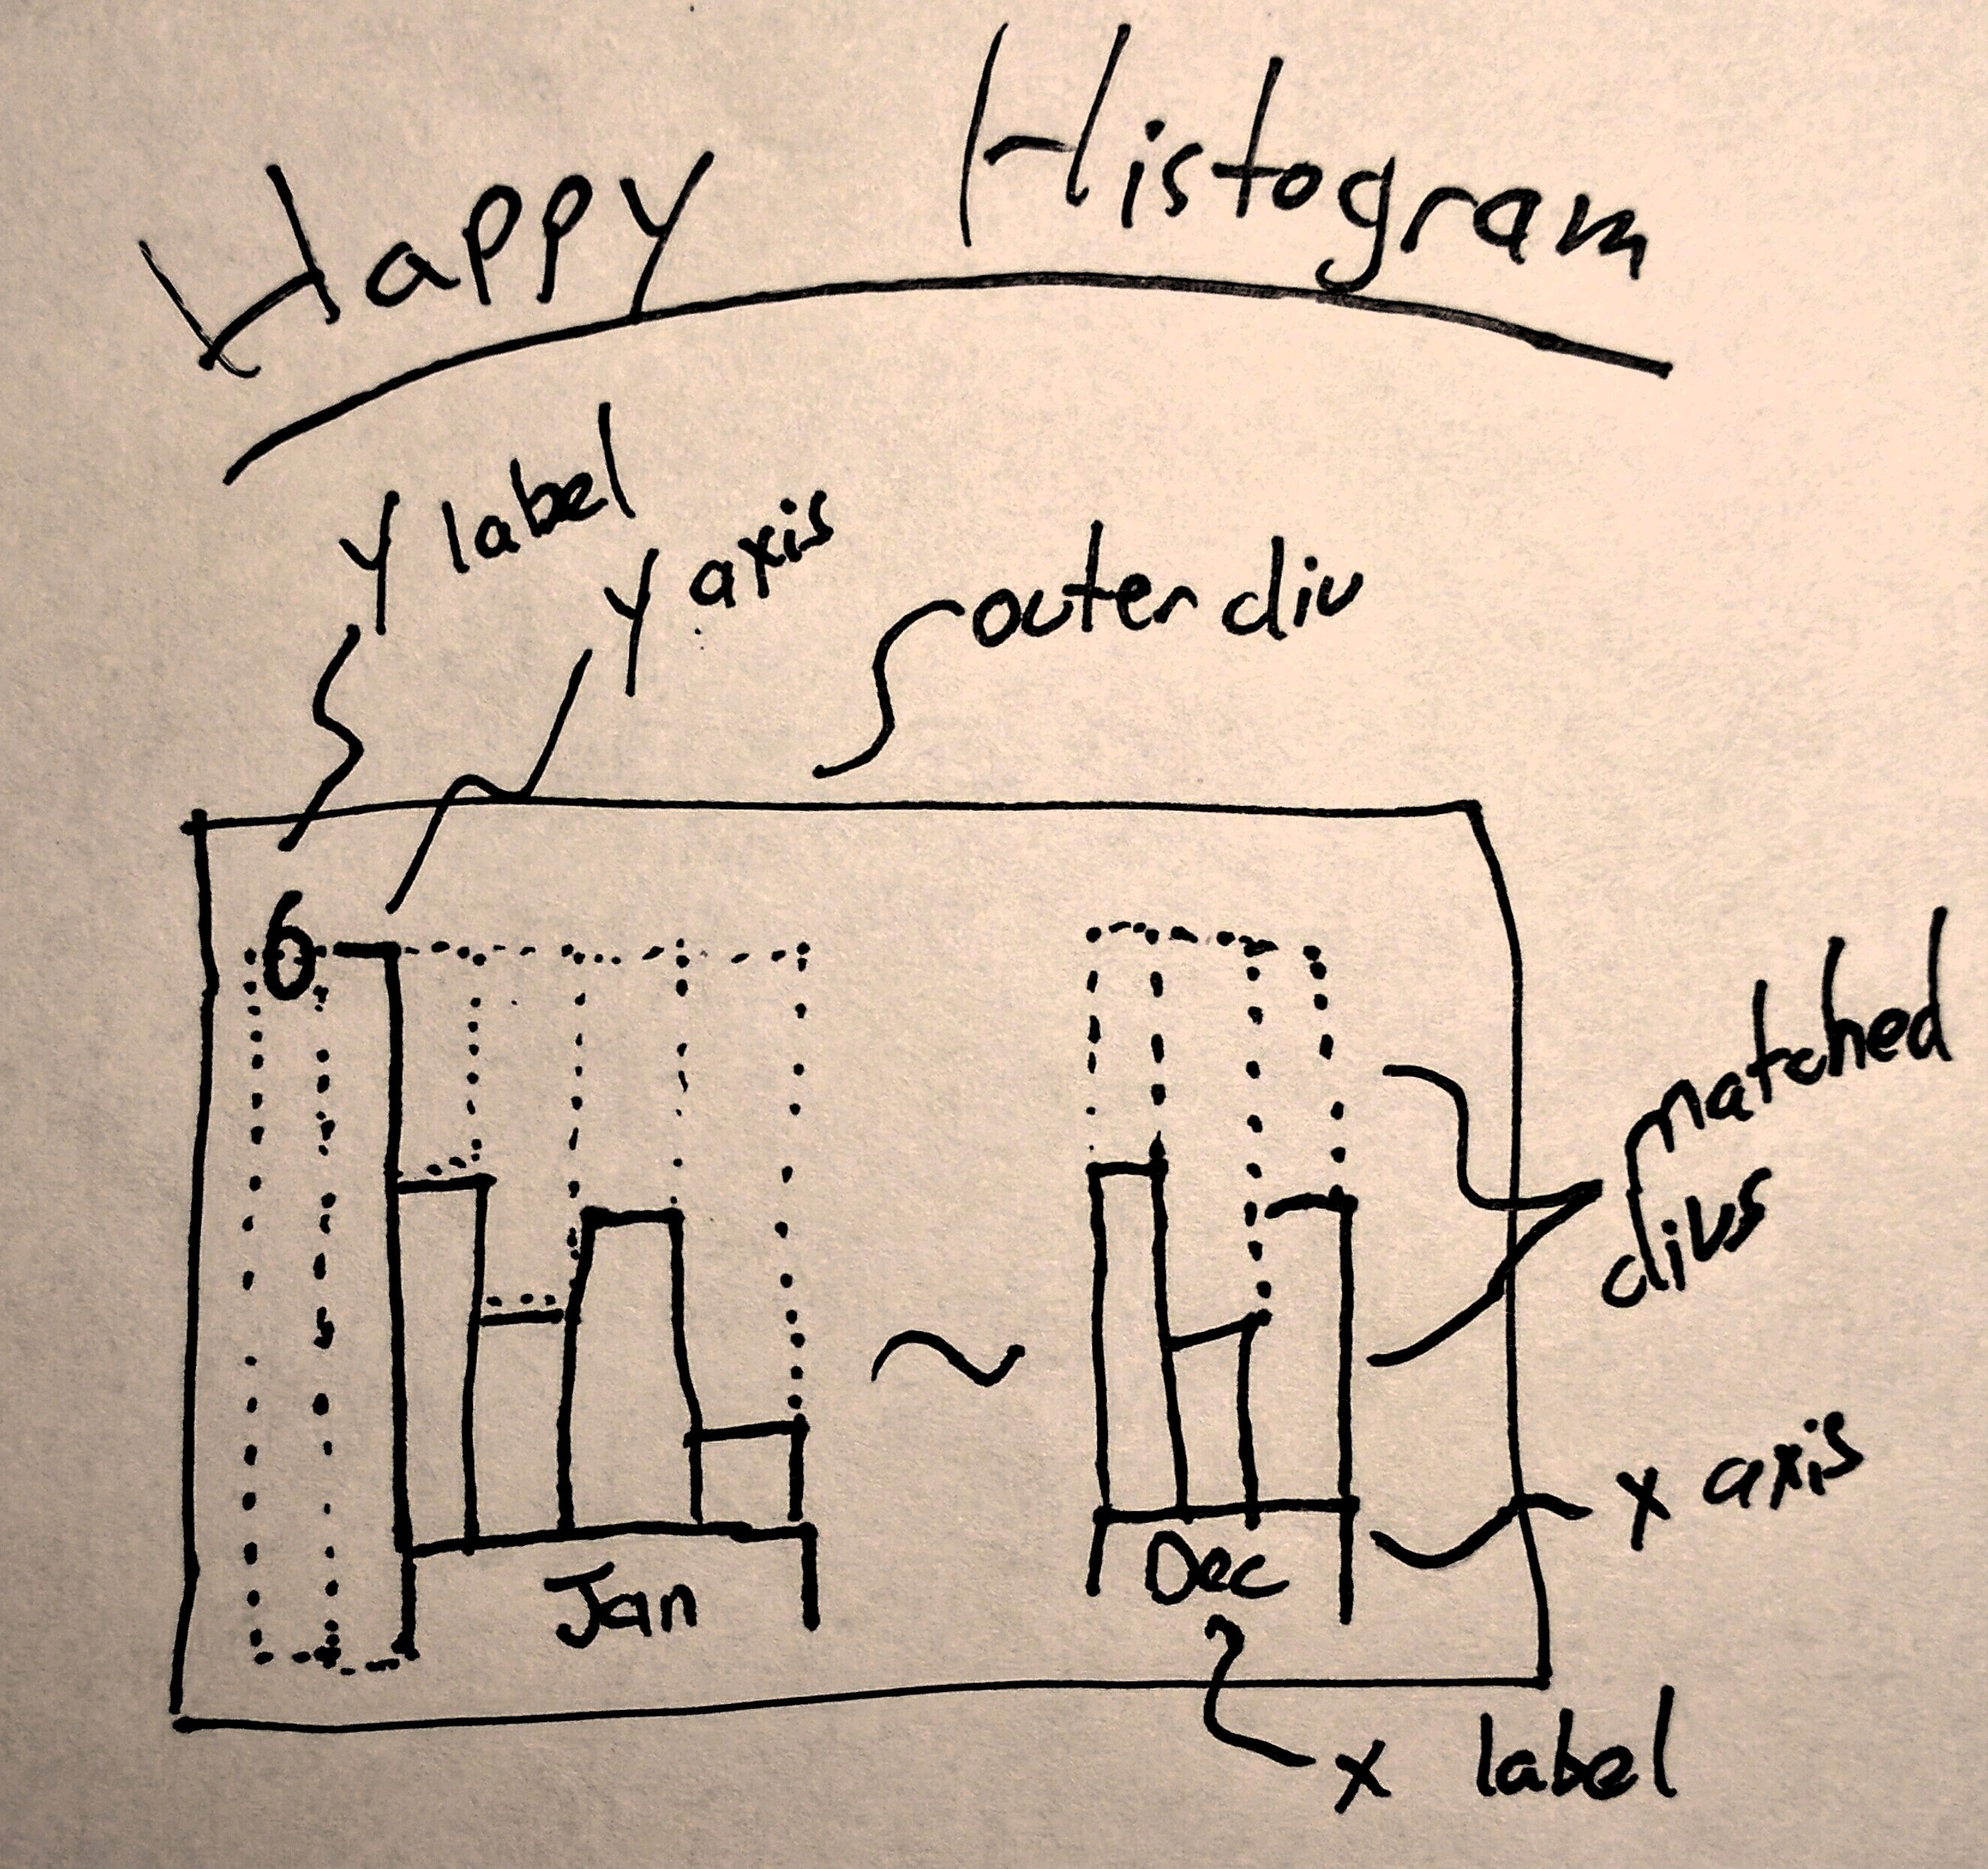
The idea is that the whole thing would just be made of DIVs styled by CSS. Since CSS is insanely precise, even allowing for negative margins, you can skooch things like x and y axes labels just where you want them.
Thus, Happy Histogram was born:
What you see there is the exact same graph as above, rendered with a whopping 900 byte JavaScript Library. Check it out on Github!
If you want to customize it, just throw a little CSS at it and make it your own:
#year2 .yearHistogram .emptyTop { background-color: yellow; }
#year2  .yearHistogram .filledBottom:hover {background-color: #ddd;}
HappyHistogram('year2', Months, 'orange');
Or maybe you just want to show one value per month? Easy Peasy:
Likely I won’t do too much more development on this unless as it is fully formed and already deployed. However, part of my job satisfaction right now stems from the fact that all new features always get pushed upstream, so y’all might see more work on this soon!
Pingback: Legba the Net-tracker – plip blog