2 minutes, 13 seconds
I’m proud to announce that I played a small role in releasing a great new JavaScript library called MapTable. This is an open source JavaScript library that accepts longitude and latitude data (CSV or JSON) as input, and outputs beautiful maps in native SVG with table of the data used to generate the map. I said I played a small role in this release because Mohammed “Simo” Elalj did 99% of the coding of the library and I just swooped in for testing, PCH specific feature requests and pushing out new builds to GitHub. Version 1.0 of MapTable was technically released way back in December of 2014, but it has been greatly improved since then (again, almost entirely by Simo :).
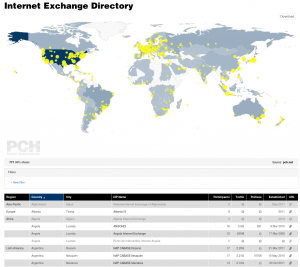 Version 1.1.1, the current version, was developed specifically so it could be used on PCH’s next generation Internet Exchange Point directory (IXP Dir). PCH’s IXP Dir was also the original use that MapTable was conceived for, so it has been a long journey until just now (as of Monday, July 25, 2016) that it has been pushed live! My main role as an employee of PCH was to complete the nascent integration done a while ago and ensure that all feature requests were made on GitHub so that the improvements would be made upstream of us for all to benefit from. It was great fun to do a deep dive into a well though out and highly function JS library.
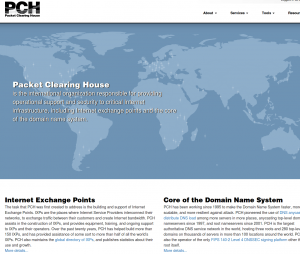 While I was in the IXP Dir, I also replaced the code on our home page which used an outdated version of MapTable. Fortunately, Simo had done PCH the huge favor of making one of the MapTable demo pages be based almost entirely on our home page. The ability to set an entirely custom color palette topped with icing on the cake of being able to specify an arbitrary SVG shape to use as markers on the map was just delightful!
While I’m wildly biased, MapTable is quite easy to use. Here’s the simplest incantation, taken directly from our docs:
Looking at the two examples I cited above, our home page and our IXP Dir, you can see that this simple snippet can be greatly extended to show either a stand alone map or an interactive, zoomable, filterable, printable, map downloadable, tooltipable and sortable map and table. The library is super awesome, and I recommend you start using it today! And yes, I just add “able” to tooltip. Try that in some other JS lib. I think not!
And, before I end this post, if you’re a JS developer and have some spare time, we’d love some help! I’m looking at you Issue #25!